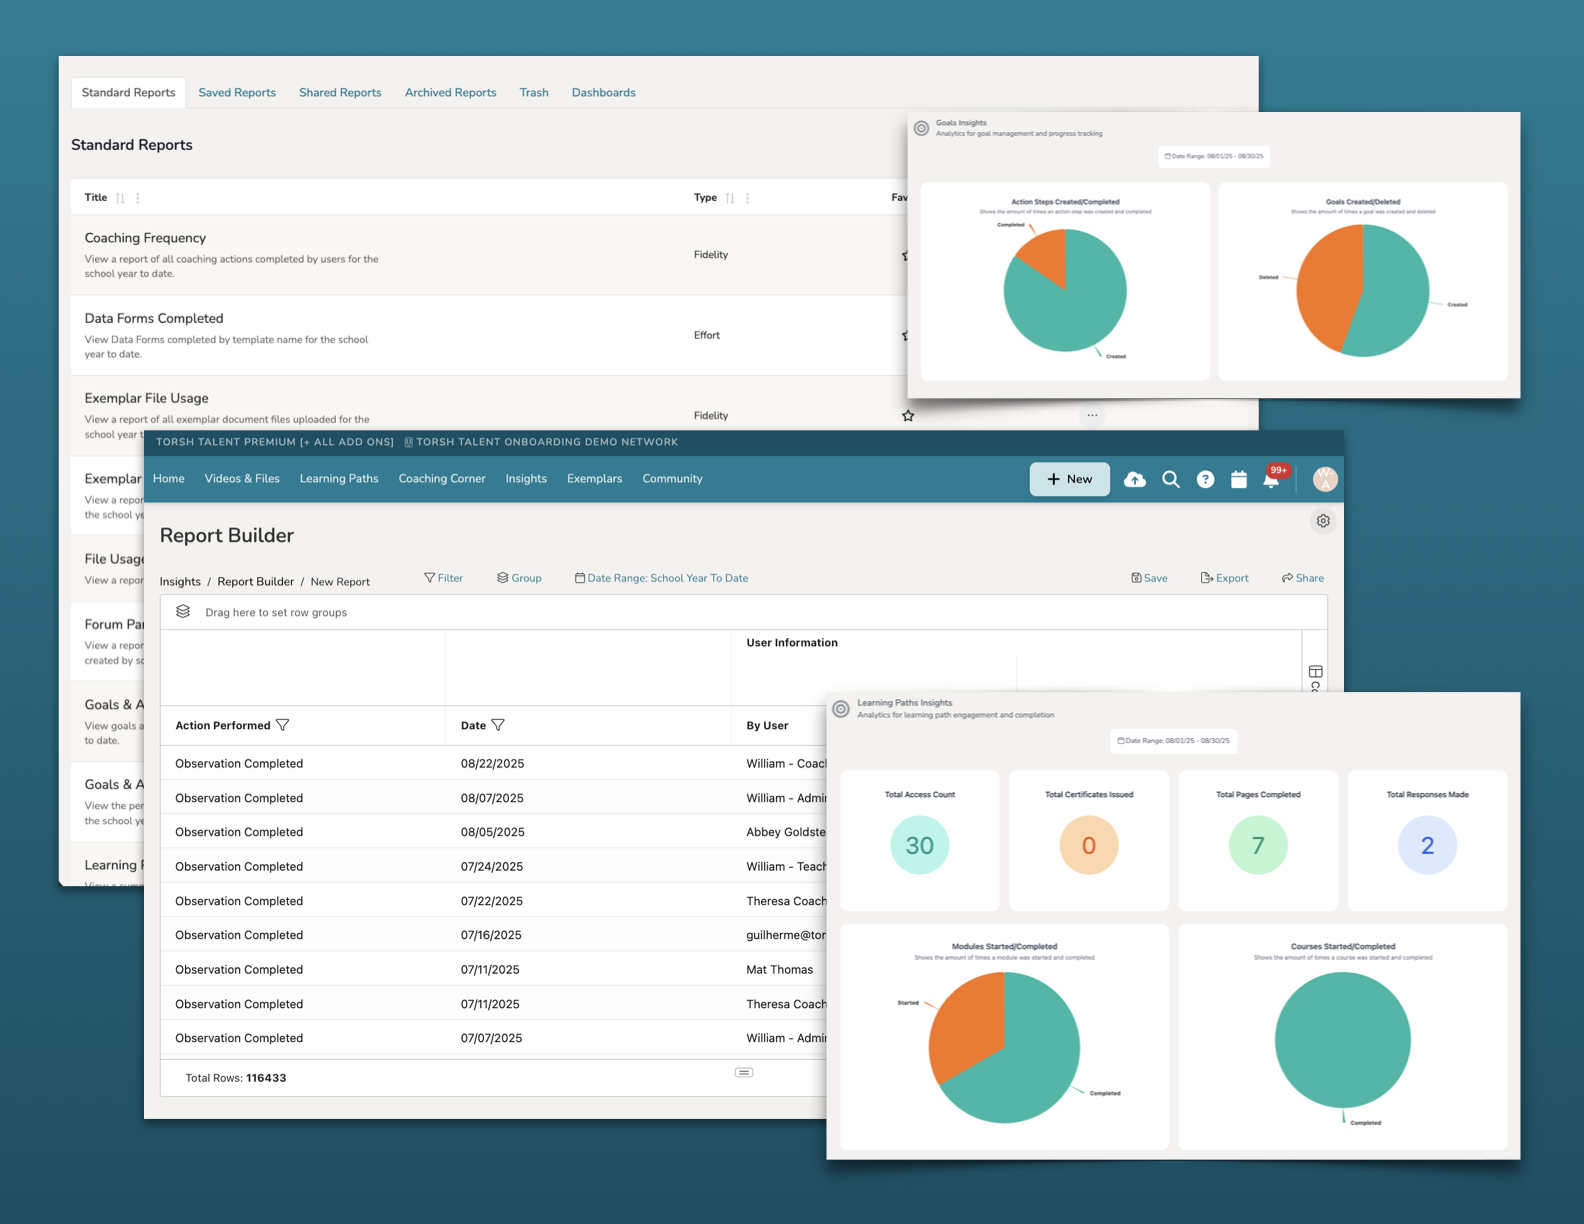
As a user of Talent, you can use our Report Builder feature to create your own customizable reports to track activity within your system! Report Builder is an assembled pivot table of all actions that you and other members of your system have accomplished.
With Report Builder, you can build reports to track coaching progress, share reports out to other members of your system, or even export your reporting as CSV files to open and configure in other spreadsheet softwares!
NOTE: Report Builder pulls all actions from our database automatically, but more recent actions completed while viewing a report may require you to refresh your web browser to load. The 'Date Range' of your specific report may also need to be adjust to factor in newer actions completed.
Contents:
I. Data Permissions in Report Builder
II. How To Access Report Builder
VI. How To Sort and Rearrange Columns
VII. How To Group Columns for Easier Organization
VIII. How To Apply Aggregate Values To Columns
Data Permissions in Report Builder
Depending on your role, you will have access to specific sets of data in your reporting:
- Admins have access to all data in the system.
- Talent HS Admins have access to all actions displayed in the system, but certain items will appear 'Redacted' if they are not shared with their account directly.
- Coaches only have access to the data associated with the group(s) and coaching assignments they are a part of.
- Talent HS Coaches have access to all actions displayed in their associated groups and coaching assignments, but certain items will appear 'Redacted' if they are not shared with their account directly.
- Mentees only have access to the data associated with just their account.
- Talent HS Mentees do not have access to Report Builder.
How To Access Report Builder
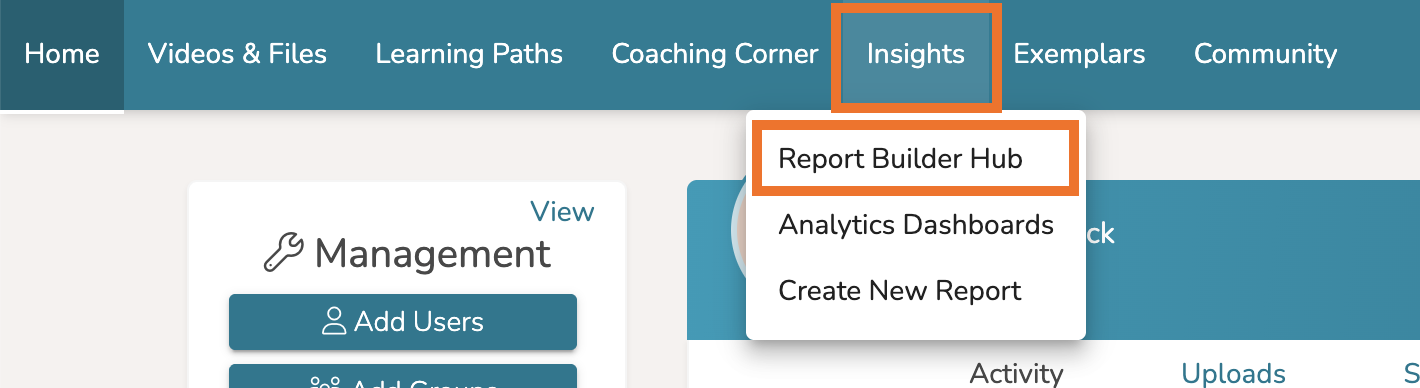
To access Report Builder, click ‘Insights’ on your top navigation bar. Or hover over Insights and select 'Report Builder Hub.'
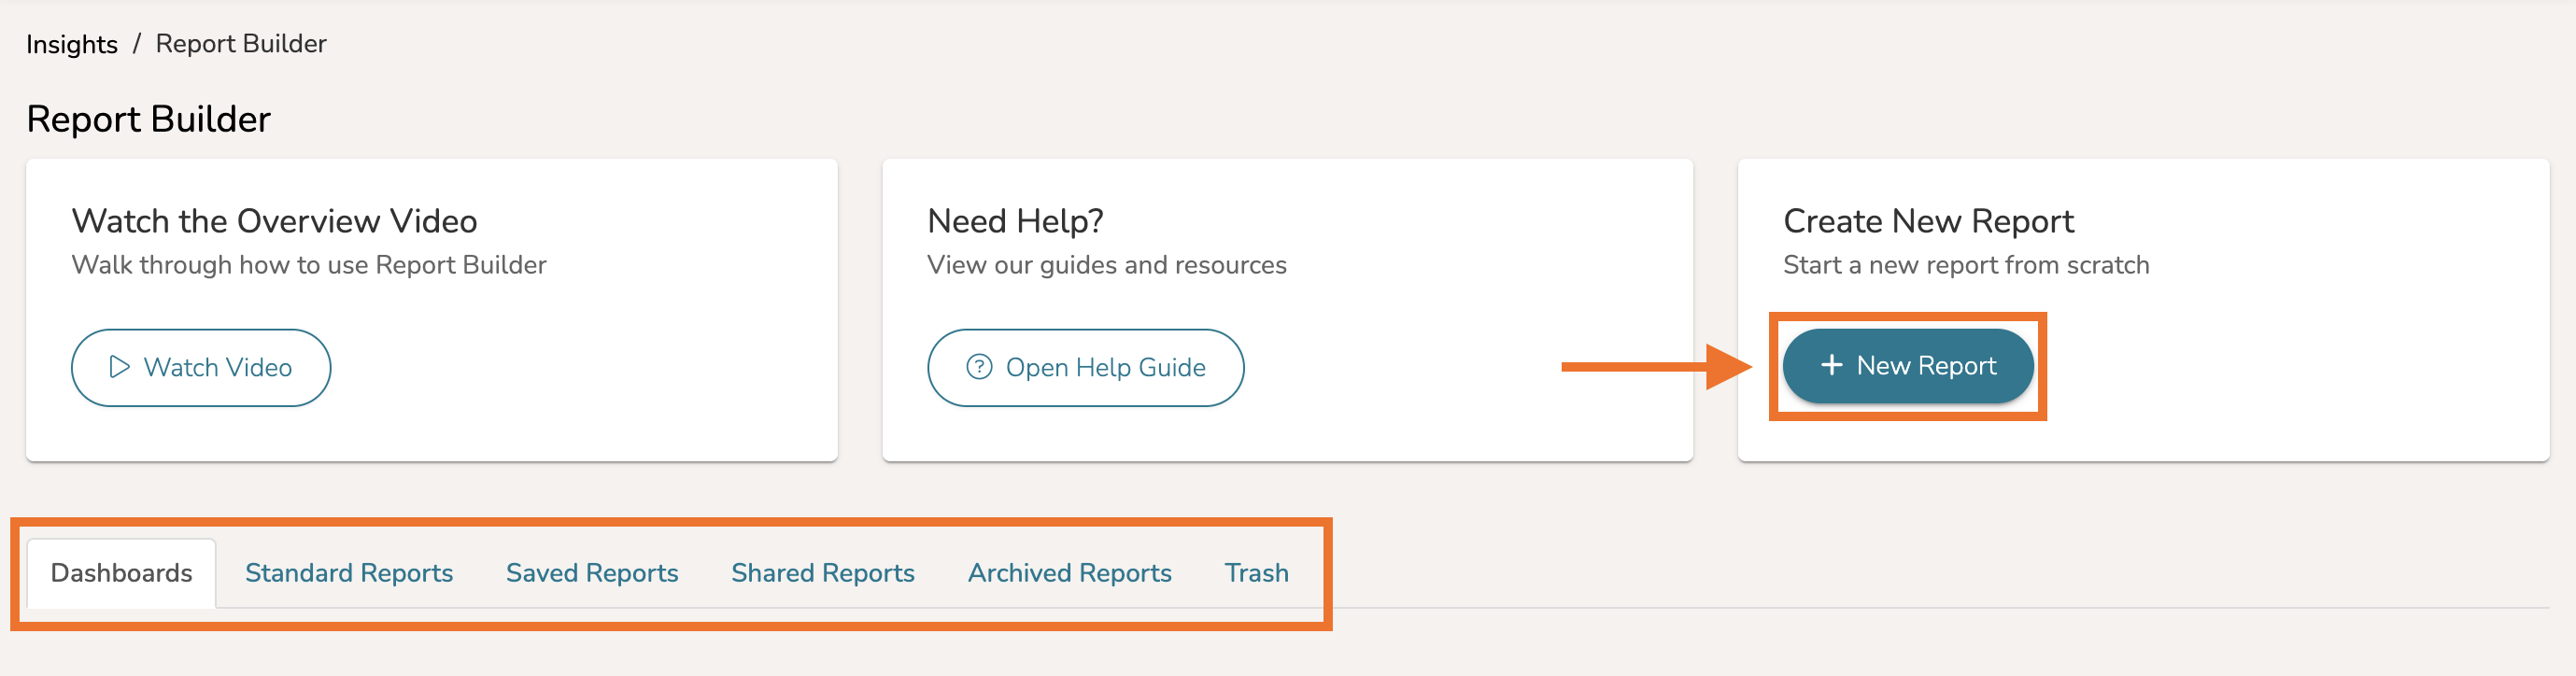
From the Report Builder Hub page, you will be brought to the visual analytics Dashboards page by default. Will also find tabs for various Standard Reports to get started with, as well as your Saved Reports, Shared Reports, Archived Reports, along with your Trash for recently discarded reports.
Click ‘+ New Report’ to create a new report from scratch.
How To Display Columns
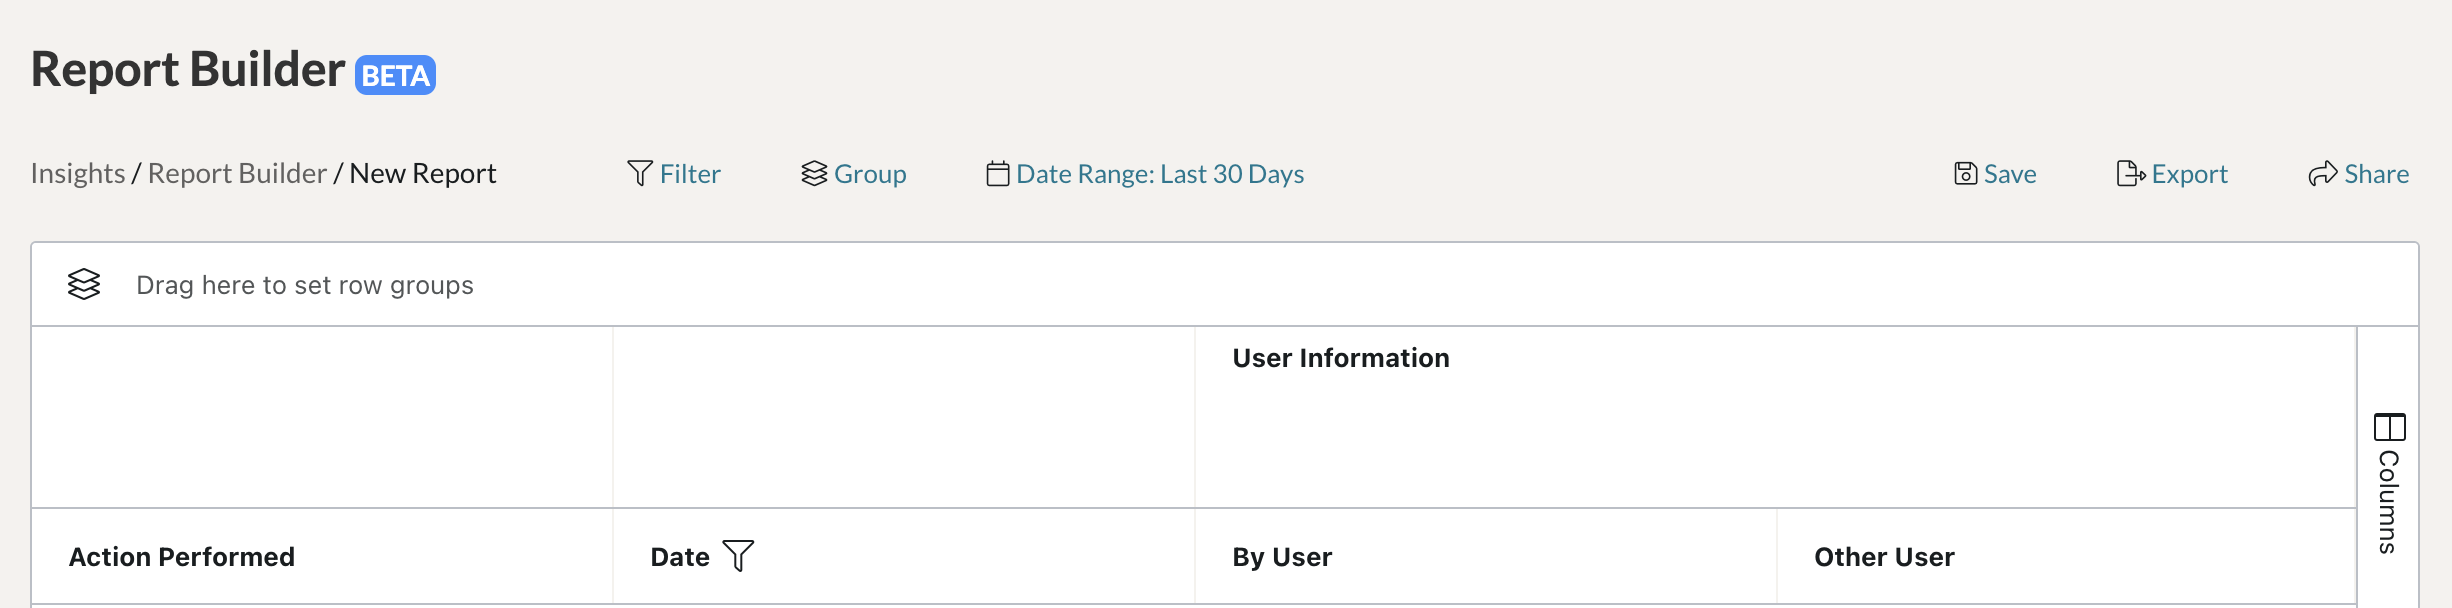
On your new report, you will find your data is filtered within the last (30) days by default. This can be changed by modifying the Date filter.
By default you will also find (4) separate columns of data:
- Action Performed - listing the specific actions performed within your system
- Date - listing the date said actions were performed
- By User - listing the user who completed the action
- Other User - listing the user for whom the action was completed for (such as in the case of a Data Form, Video Share, or Observation)
You can display more columns of data by selecting ‘Columns’ on the far, right side of your report. Doing so will open a new window by which you can choose specific columns of data to display on your report. Check or uncheck the different columns to change what data displays.

Types of Data
TORSH's reporting is built around the Practice-Based Coaching Data Informed Decision Making framework (PBC-DIDM). This framework encourages practitioners to focus on the following key questions:
- Effort - What Effort am I expending in my coaching activities? (Are we doing what we said we would do?)
- Fidelity - Are we doing the things we said we would do at Fidelity? (What is the quality of my effort?)
- Impact - Are the things we are doing having the intended Impact? (What is the effect of my efforts?)
Under the Columns data found on the far right of your report, you can filter the data you are looking for by clicking on each of these (3) data types. They will display in the menu according to the data type you select, each one designated by a different color.

How To Filter Columns
Using the Report Builder tool, you can choose to specify which data appears in your columns with the use of filters! Within Report Builder, you have (3) different methods by which you can filter your data:
1.) Filtering with the Filter Button
For starters, you can click the ‘Filter’ option above the report. This will load a new window specifying the column you would like to filter, the operator that adjusts the filtering, and the value you would like to filter by. If you would like to add another column filter, you can click ‘Add Condition’ to filter another column’s data. If you would like to delete a filter, simply click the ‘Trash Bin’ icon on the far right, or click ‘Reset’ to delete all of your current filters. Click ‘Filter’ to save any changes you make to your filters.
2.) Filtering by a Column's Menu Icon
The second way you can filter is by clicking the ‘Menu icon’ found in the column header. This will load a small pop-up menu displaying a Filters menu.
In the Filter menu, click the dropdown menu to change your operator, and in the ‘Filter…’ text box, type the value you would like to filter by.
3.) Filtering with the Filters Menu on the Right
The third way you can filter can be found on the far right side of your report. Here you will find another Filters menu and a Columns menu. Click ‘Filters’ to open a new window by which you can choose a specific column and adjust its specific filter. Click the dropdown menu to change your operator, and in the ‘Filter…’ text box, type the value you would like to filter by.
As soon as you enter your selections, the data automatically adjusts!
How To Sort and Rearrange Columns
You can further sort your column’s data by either ascending or descending values by tapping inside of the column header.
To rearrange the order in which your columns are displayed, simply drag and drop a column to your desired location along the report.
How To Group Columns For Easier Organization
Within Report Builder, you also have (3) different methods by which you can group your column data into different row groups:
1.) Grouping with the Group Button
Firstly, you can click the ‘Group’ option above the report. This will load a new window wherein you can specify the first column you would like to ‘Group By’ as well as the next column you would then like to group your data by afterwards (‘Then By’).
You can add another column to group when you click ‘Add Column.’ You can delete a grouped column by clicking the ‘Trash Bin’ icon on the right side of the column selection. Click ‘Group’ to save any changes you make to your grouping.
2.) Grouping by Drag n' Drop
You can also group columns into different row groups by simply dragging and dropping a column header to the area specified ‘Drag here to set row groups.’ Doing so will automatically group the data by the column you selected.
If you click the ‘stacked group icon’ beside the row group title, you can then drag it again to rearrange the order in which your data is grouped (see below):
If you would like to delete any of your groups, simply click the ‘X’ icon beside the title of the row group.
3.) Grouping with the Columns Menu on the Right
The third way you can group columns can be found on the far right side of your report. Click the ‘Columns’ menu. Underneath the list of columns, you will find another designated area stating to ‘Drag here to set row groups.’ Click the 'stacked group icon' beside each column title and drag it to the Row Groups section to automatically group the data by the column you selected. You can also drag these options to the section found above the report.
If you would like to delete any of your groups, simply click the ‘X’ icon beside the title of the row group.
How To Apply Aggregate Values To Columns
There are (2) methods by which you can aggregate your data and/or perform further calculation on specific columns. This can be useful if, for instance, you’d like to find the Average or the Sum of a specific set of data.
NOTE: Aggregating data can only be accomplished once you have grouped a set of columns together into row groups.
1.) Aggregating by a Column's Menu Icon
Once you have grouped your data, you can aggregate by simply clicking the ‘menu icon’ of the column header you would like to apply the calculation to. In the new dropdown window you should now see an option for ‘Value Aggregation.’
Click it, and a dropdown list of various calculation types will appear. Select the calculation you would like to produce. Now you will see that calculation applied to the first row of each grouped entry.
2.) Aggregating with the Columns Menu on the Right
You can also assign value aggregation by clicking the ‘Columns’ menu on the far, right-hand side of your report. Make sure that your data is already grouped.
After clicking on the ‘Columns’ menu, a new window will appear. In the new window, under ‘Values,’ you can click and drag column data from the Columns list into the section labeled ‘Drag here to aggregate.’

The different columns you drag will apply a default aggregation to each column you choose. You can edit the calculation of each aggregation by clicking on the aggregation you chose. This will produce a dropdown menu with each calculation type listed.
Choose which value calculation you would like to apply, and it will apply automatically to your column!
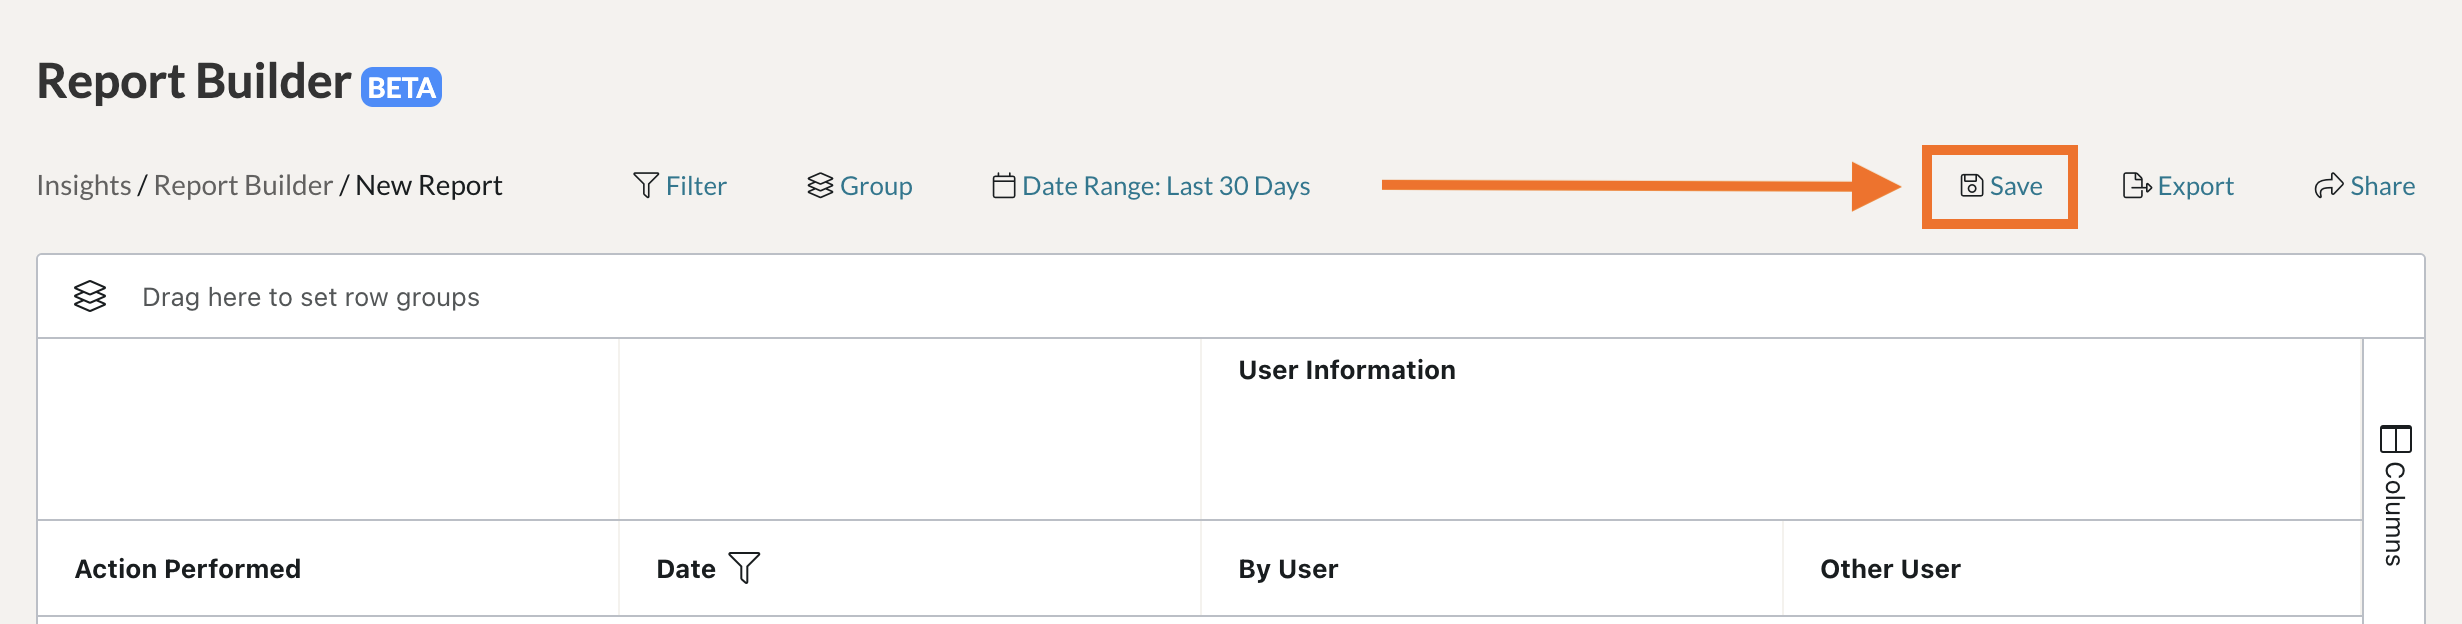
How to Save a Report
To save your report so that you can view it and adjust it for later use, click ‘Save’ in the top, right-hand corner of your report.
This will open a new window wherein you can name your report, give it a brief description, and then designate the overall data type you are using for this report.
Click ‘Save’ to save the report.

Now when you visit the Report Builder Hub page, you will find this report under ‘Saved Reports.’
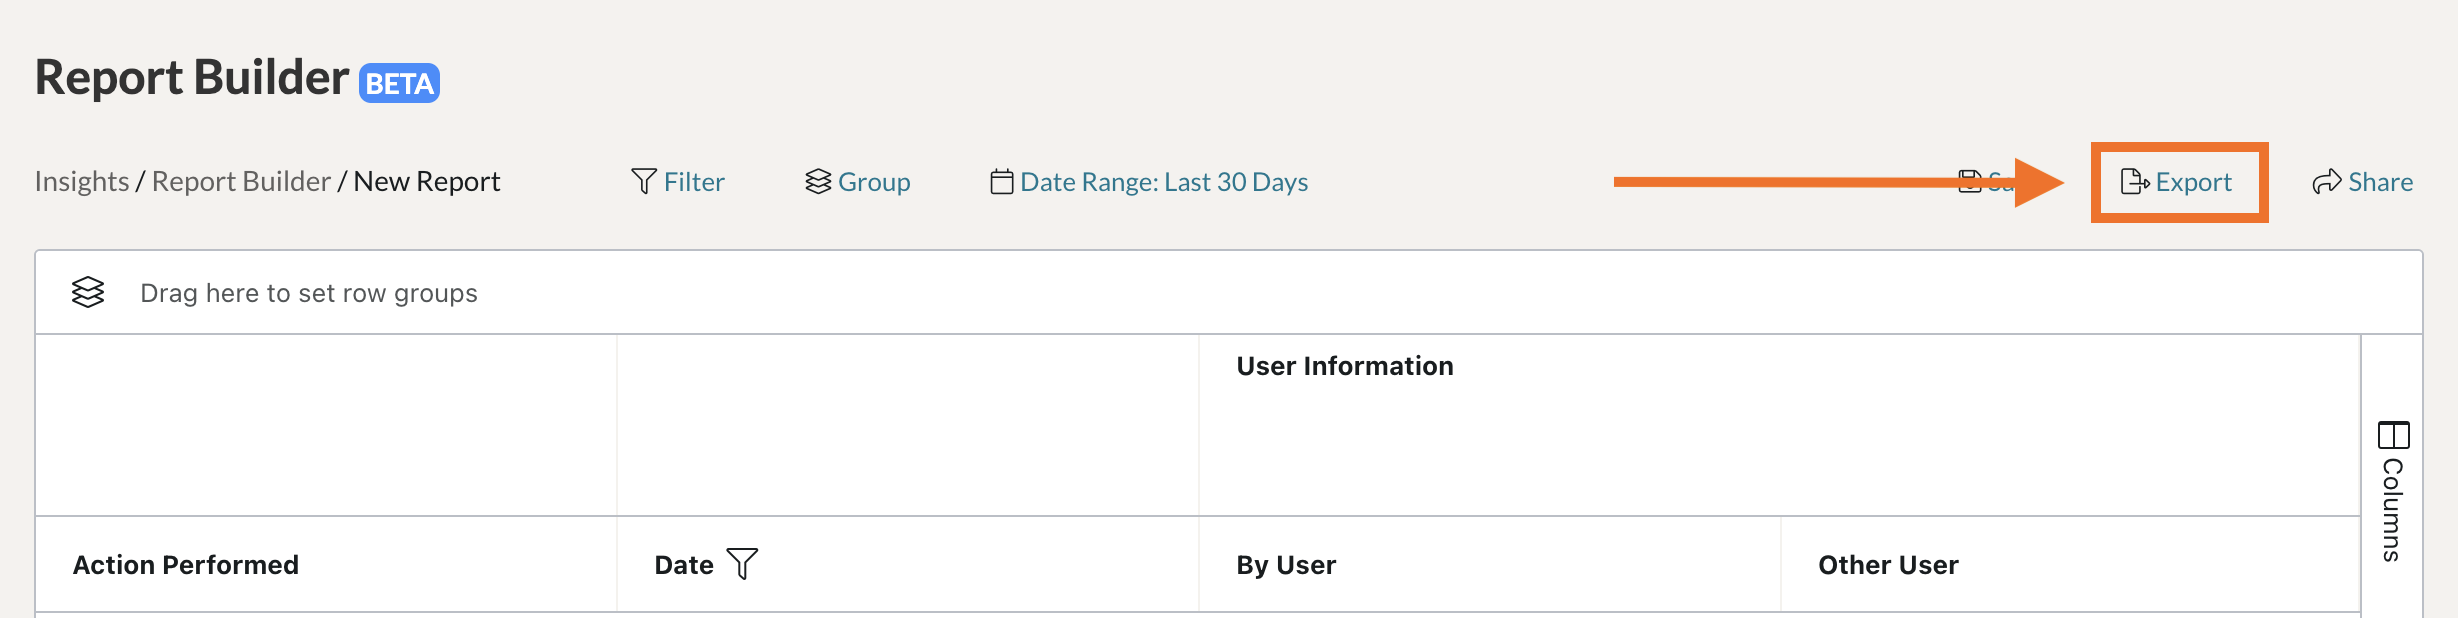
How To Export a Report
To export a CSV file of your report, click ‘Export’ in the top, right-hand corner. This will automatically save a CSV file of your report to your device.
How to Share a Report
If you would like to share your report, click the ‘Share’ button found in the top, right-hand corner.
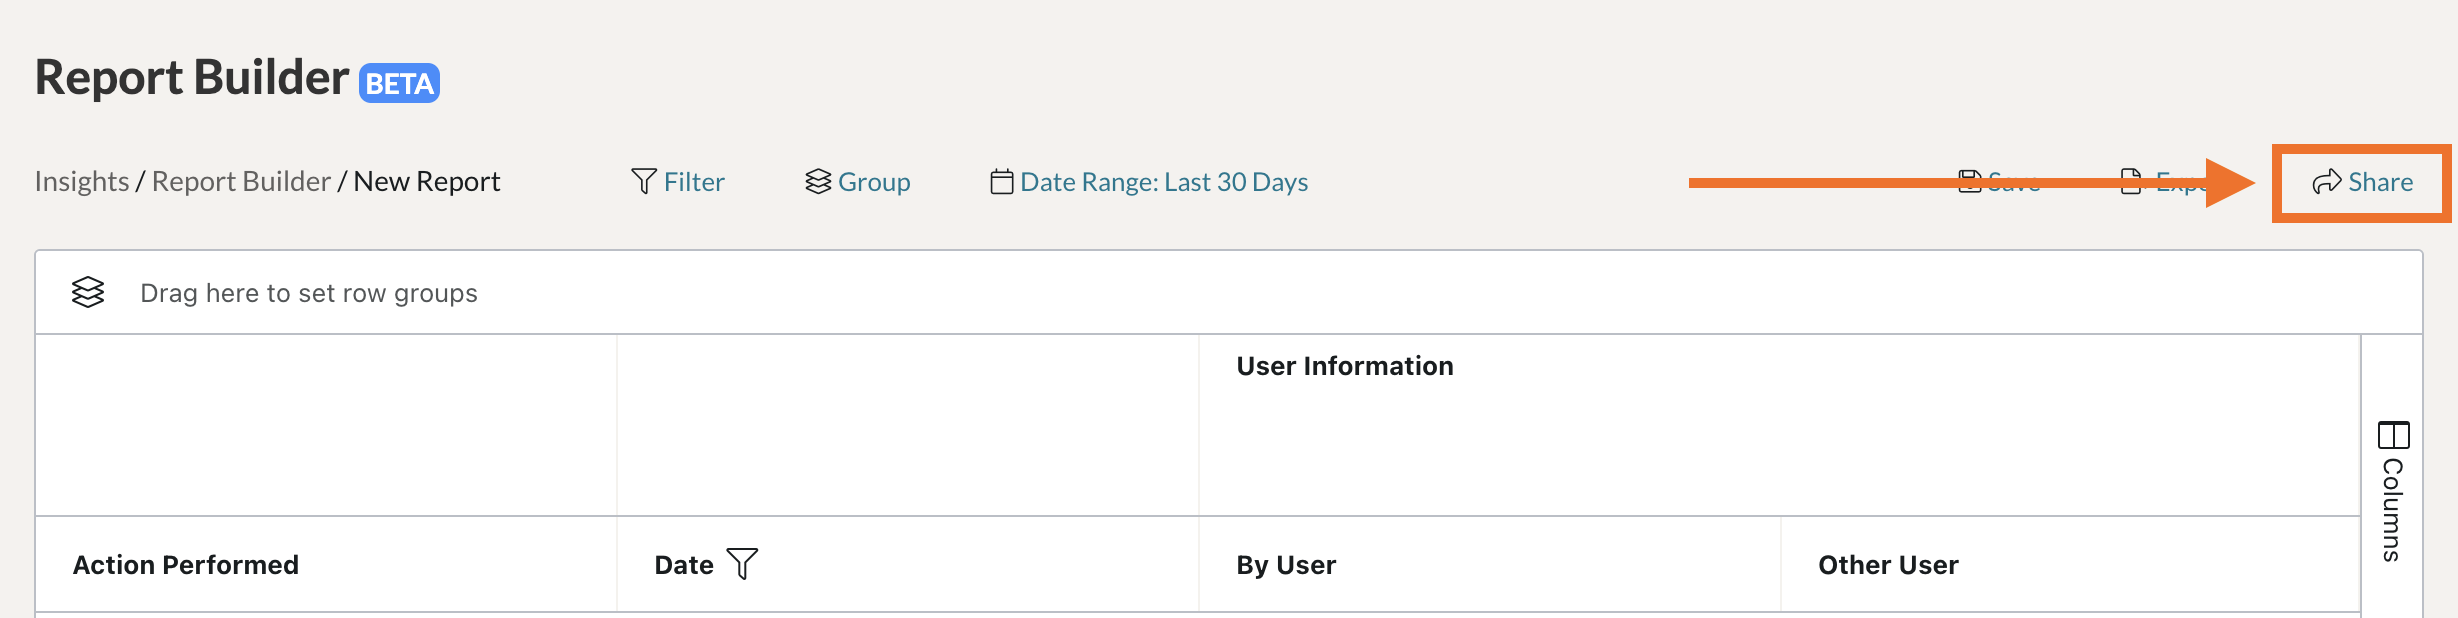
If you have not already saved the report, a new window will appear, wherein you can name your report, give it a brief description, and then designate the overall data type you are using. Upon clicking ‘Save,’ a new pop-up window will appear.

In the Share pop-up modal, enter the name of the user you would like to share the report with and then click ‘Share & Notify’ to share the report. The user with whom you shared it with will now be able to find it on their Report Builder page under ‘Shared Reports.’

NOTE: While Admins and Coaches/Mentees have access to the Report Builder tool, they will not have access to the same set of data.
- Admins have access to all data in the system.
- Coaches only have access to the data associated with the group(s) and coaching assignments they are a part of.
- Mentees only have access to the data associated with just their account.
Here is a video tutorial on how to use the Report Builder feature!